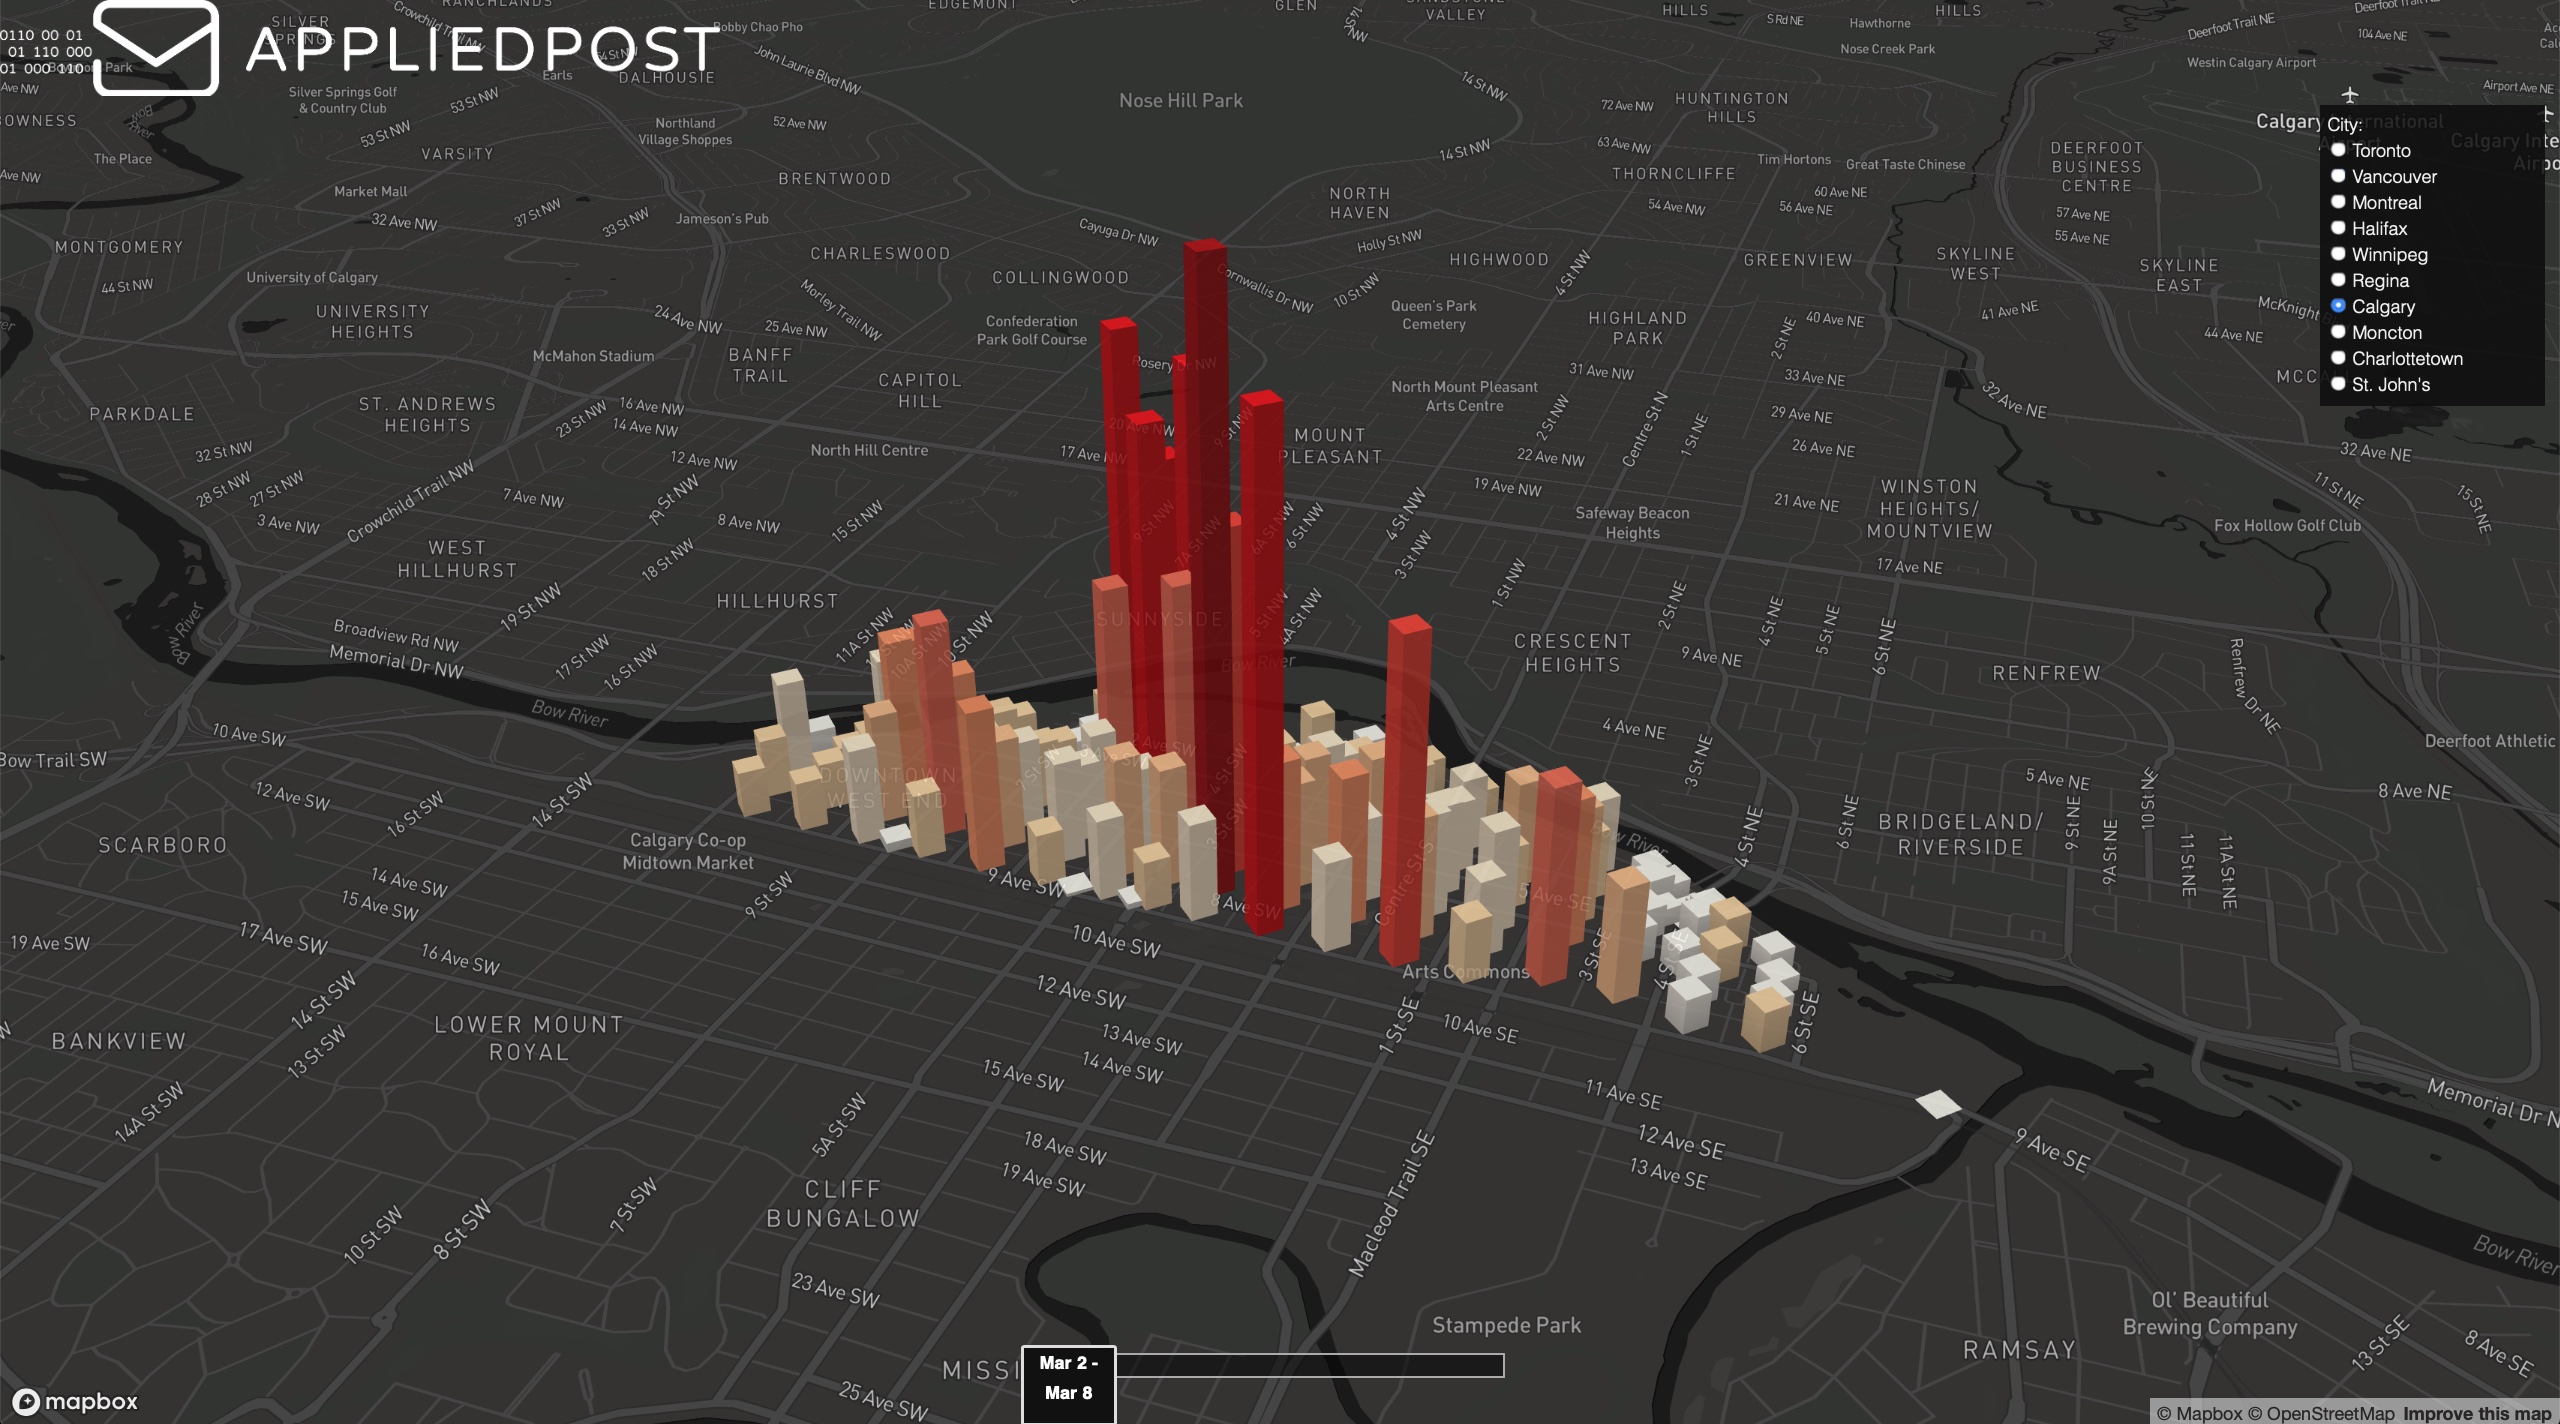
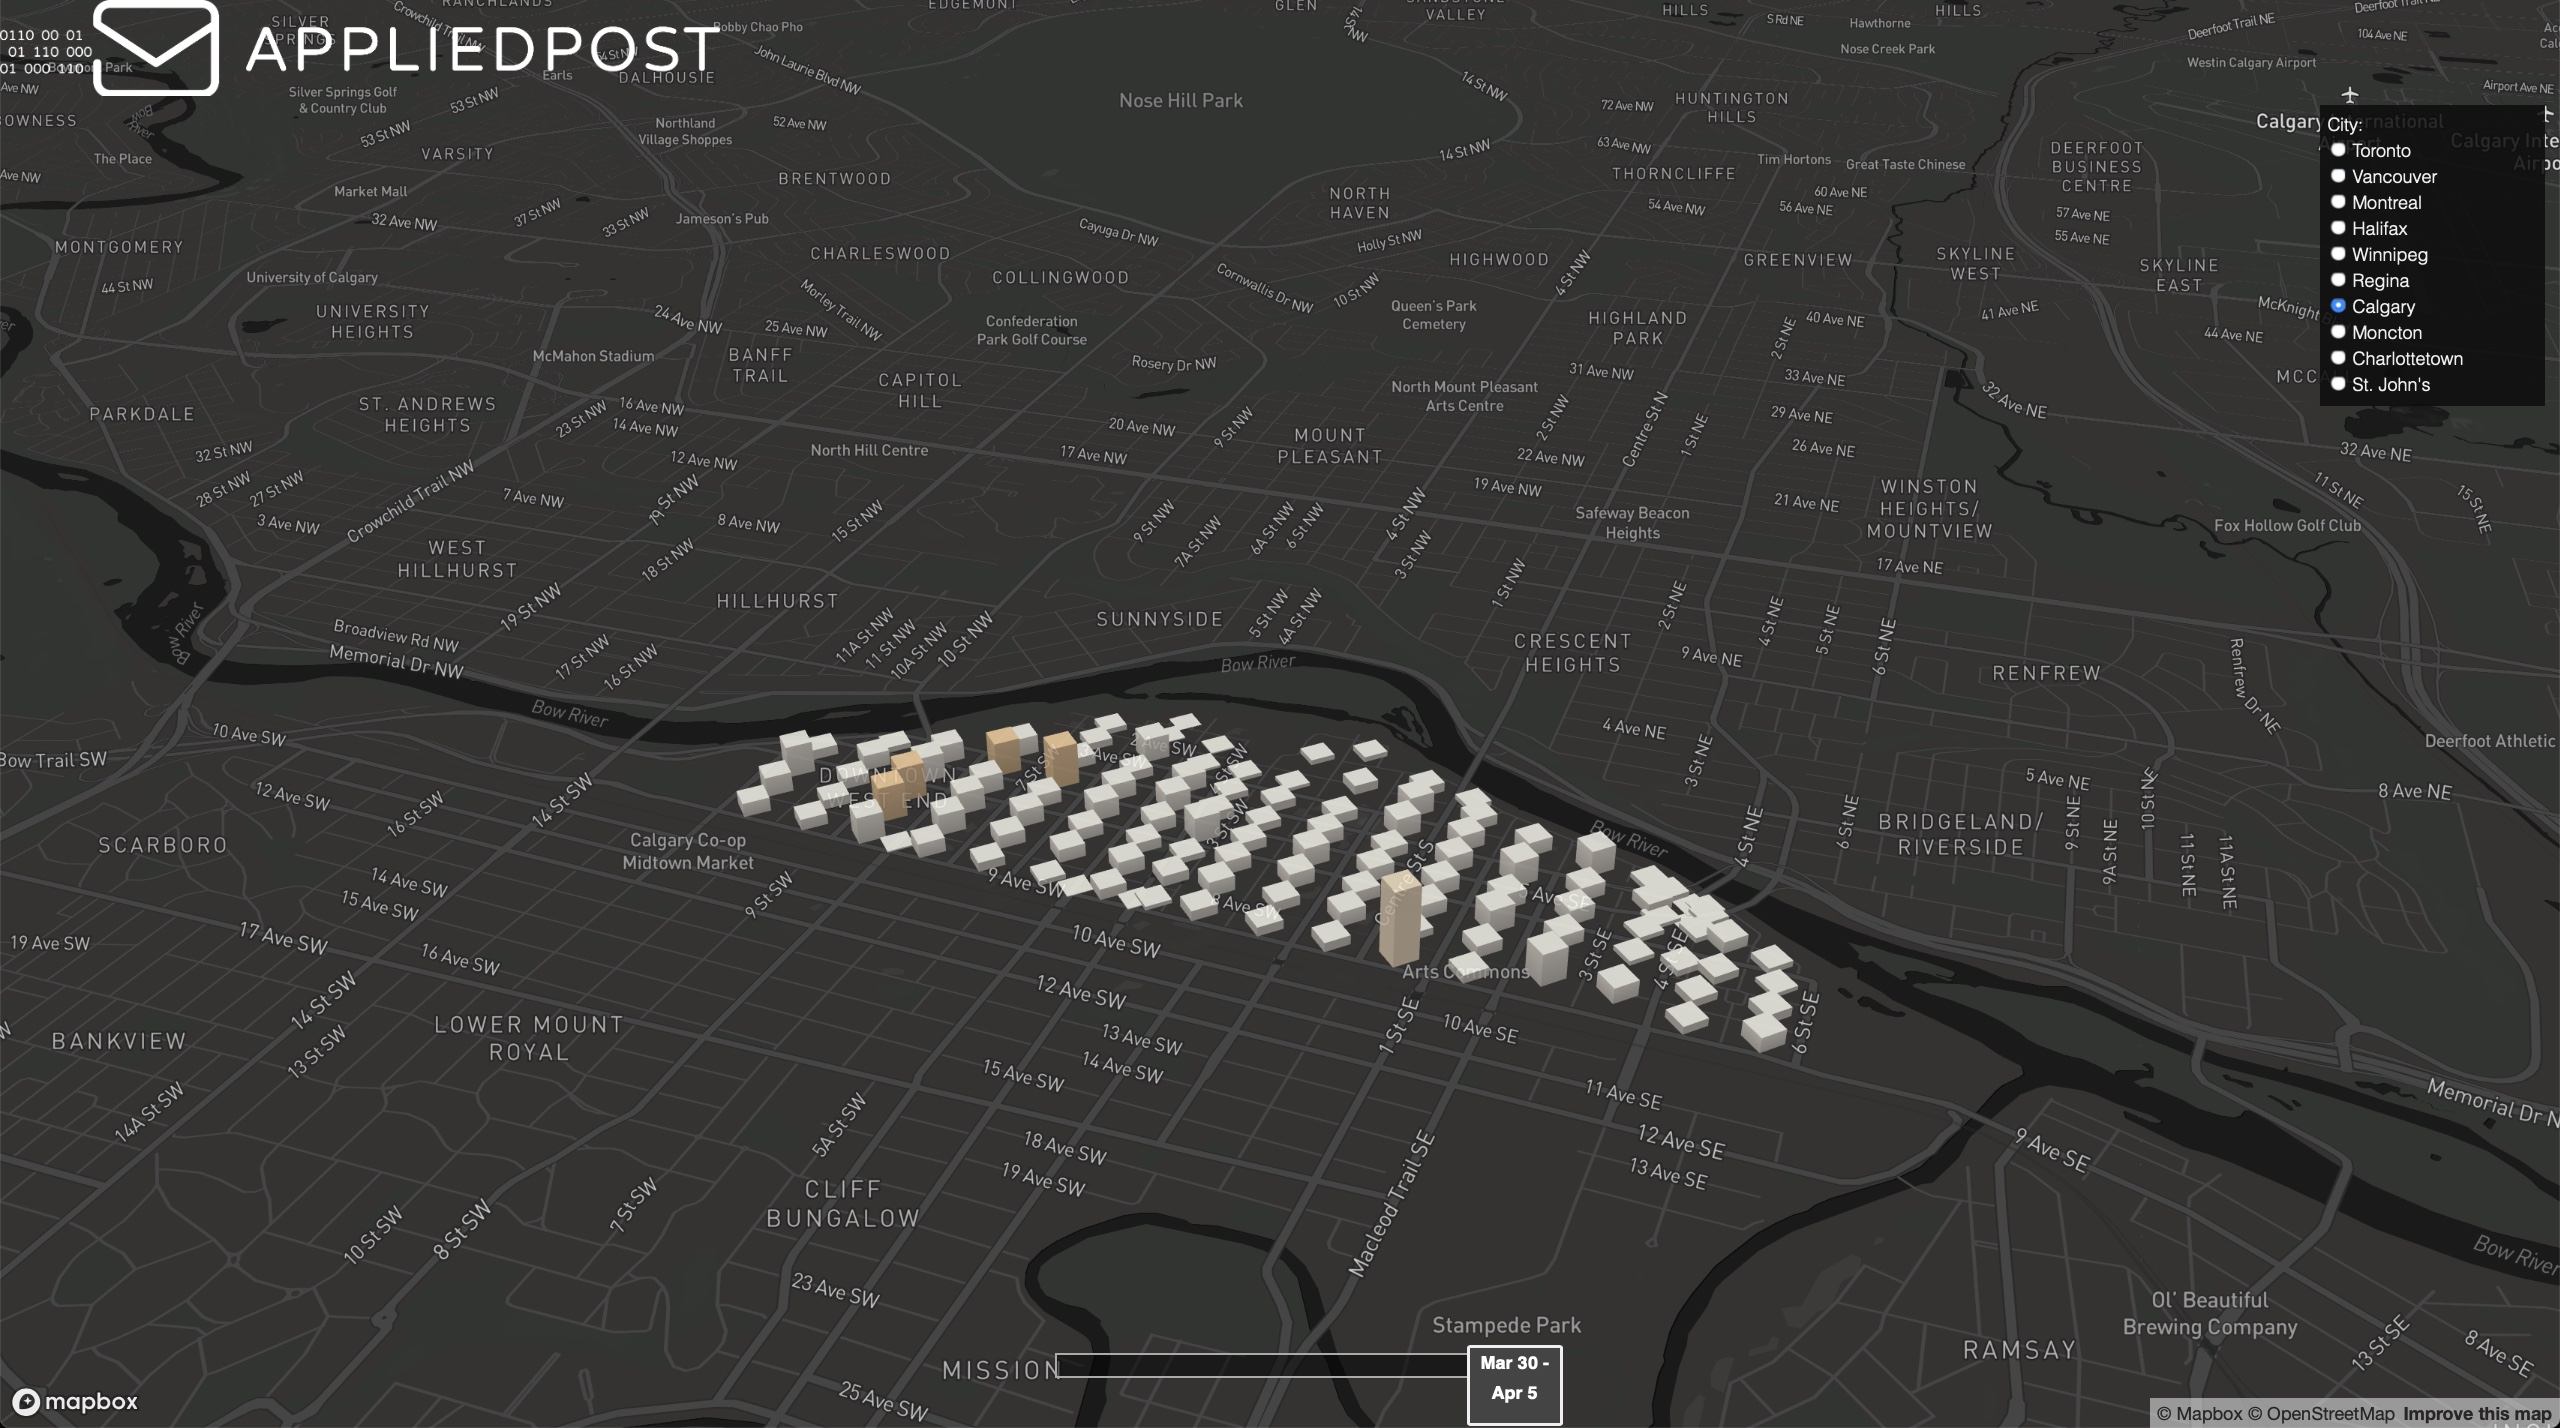
So now that most Canadians have been in some form of “lockdown” for several weeks, we thought we would look at which Canadian city has done the best. For this we took the largest city in each province across the country and looked at their central business district (CBD). We wanted to understand daily traffic flow in and out to see which has seen the largest decrease in activity. Using our anonymized mobile data (see below) we monitored this travel flow per block. We took these numbers averaged out against the full CDB for each city to come up with a single average which we used to track these reductions. So, the first week of March acts as our baseline compared to the amount of inflow/outflow we see each week. Anyway, enough about the method and let’s get to the results to the end of last week…
- Calgary – 85.5% reduction in traffic
- Moncton – 84.3% reduction in traffic
- Toronto – 82.2% reduction in traffic
- Montreal – 81% reduction in traffic
- Halifax – 78% reduction in traffic
- St John’s – 77% reduction in traffic
- Charlottetown – 75.2% reduction in traffic
- Winnipeg – 75.19% reduction in traffic
- Vancouver – 69% reduction in traffic
- Regina – 65% reduction in traffic
To see/play with the visuals and data for these, have a look at this link…
While we can argue about what block should be in or out of the CDB we did our best to capture the core but please let us know what you think.
*This report is powered by mobile data that is collected by privacy compliant SDK’s and it is put through an anonymization process that we use in our products every day. All data is grouped with the same standards that StatsCan undertake so that no results can be tracked to an individual household. These privacy-preserving protections also follow the standards set out by PIPEDA.